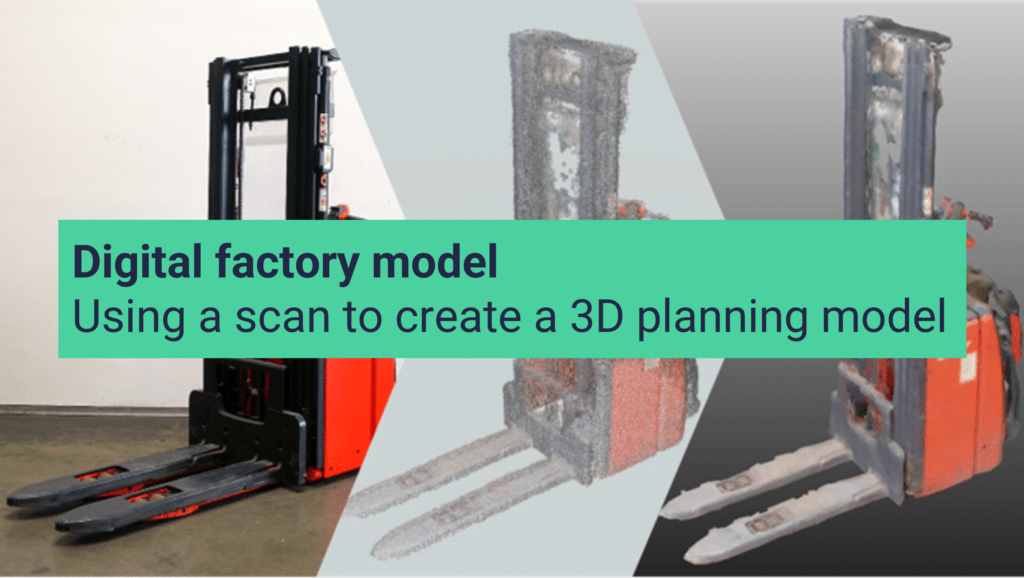
Layout planning – Use case for material flow-optimized layout
Based on the use case of a compressor manufacturer, we would like to take a closer look at the procedure for layout planning. The company is a medium-sized manufacturer of piston and screw compressors. The layout is to be planned for the company’s entire internal value chain. The production refers to the housing or the basic body of the compressors, the injection molding of plastic housings and the production of turned parts. All other parts and components are purchased parts that are used directly in the assembly of the finished products. Depending on the type of compressor, different processing steps are carried out at different stations.
Design of the value stream
Possible sources of reference for the required values and information are work plans, production orders, movement data and parts lists. These can be used, for example, to determine process steps, material flows or the number of machines required. The Value Stream Design was created on the basis of this data collection. The illustration shows an example of such a value stream for the production of a piston compressor.

Dimensioning the surfaces and defining the structure
The dimensioning of the areas in Plavis visTABLE® was based on the future production program and capacity planning. These were first divided into the functional areas of logistics, production and assembly.
In addition to the three areas to which this use case relates, an administrative wing was created at the front of the building, which is not defined further here.

From block layout to detailed layout
The project began with detailed planning in the area of logistics. Logistics was divided into four different areas. Incoming goods with high-bay warehouse, quality assurance, supermarket and outgoing goods with high-bay warehouse. The production area was then defined in detail. In addition to the floor plan, the basis for this is the production process created, which can be taken from the value stream. The block layouts of the individual stations were designed in such a way that the material flow is as optimal as possible. The material flow is described and explained in detail in a later part of the use case. Due to the different variants of compressors to be produced, the layout contains different stations, whereby not every station is required to produce every variant.

Detailed planning of ergonomic workstations in 3D
The production systems were then modeled and assigned to the corresponding stations. The same applies to the leak test and the final assembly check. Assembly stations were modeled for the assembly lines, which were also integrated into the layout in this step. The systems are not necessarily the correct systems, as the Plavis visTABLE® model catalog only contains a limited number of variants. All systems are therefore to be regarded as schematic representations.

From layout to material flow analysis
So far, the added value of the layout developed up to this point has been that it has given a better impression of the area actually required, including traffic routes, as well as an appealing visual presentation. The real added value is only now being created. By linking the processes (value stream) with the layout. By physically locating the resources stored in the value stream, the material flow can now be quantified and thus subsequently optimized. All source-sink relationships are now stored and visualized in blue, as shown in the use case here.

The heat map shows potential bottlenecks
The analysis options in Plavis visTABLE® consist of network load, logistics evaluation and area balance. The network load is considered first. This is based on the utilization of the transport network by all product groups in the system. Here, the individual sections of the transportation network are considered separately and assessed according to the flow rate of the products. The assessment is divided into a color scale – green to red – on the transport network. The use case clearly shows that the transport route to and from the supermarket is particularly heavily loaded. This is due to the high volume of transportation, as the products are taken to the supermarket after the respective processing steps.

Evaluation of the material flow using KPIs
Next, the logistics evaluation is considered. The logistics evaluation refers to the material flow analysis along the value stream. In order to illustrate this evaluation in a simplified manner, the focus here is on one product family – reciprocating compressors. The material flow can be represented visually, which makes the linking of the individual stations visible and, if necessary, reveals initial optimization possibilities. The material flow runs along the value stream via the transportation network to the individual logistics, production and assembly stations. The current status of the material flow to be evaluated can be read off using KPIs such as the total route.

Material flow optimization through drag & drop
By moving individual blocks in the block layout, the material flow can be optimized easily and clearly illustrated. To illustrate this, the position of the cleaning unit (marked in red) in the use case has been changed so that the material flow is reduced by 10 %, as the cleaning unit has been moved closer to the machining center (marked in blue).

Bross Consulting offer support in layout planning and optimization
Our experts have many years of experience in layout planning and material flow optimization. We look forward to hearing from you!